Visualisations
Dataset visualization
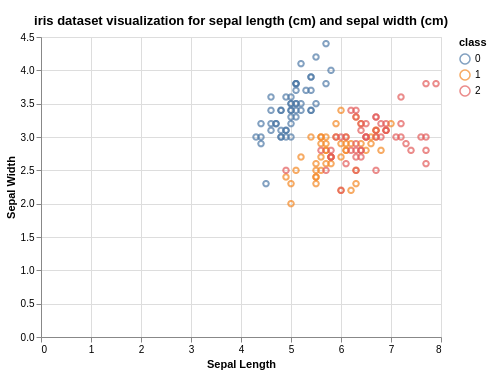
Scatter Plot
PyPaDRe supports different visualizations for the dataset as well as results. For example,
Scatter plot for the attributes of dataset can be created in the form of json specification(vega lite).
For creating visualization altair library is used.
To create scatter plot pypadre.core.plot.Plot.get_scatter_plot() function is provided in the plot module which should be
called with dataset attributes of the users choice.
ds = dataset
app.backends[0].dataset.put(ds, allow_overwrite=True)  # Save dataset locally


plt = plot.DataPlot(ds)
vis = plt.get_scatter_plot("sepal length (cm)",
                           "sepal width (cm)",
                           "Sepal Length",
                           "Sepal Width")

# Save visualization locally for above dataset
app.backends[0].dataset.put_visualization(vis,
                                          file_name="scatter_plot.json",
                                          base_path=os.path.join(app.backends[0].dataset.root_dir, ds.name))
Note: :pypadre.core.plot.Plot.get_scatter_plot takes x attribute and y attribute as required arguments for which plot should be created.